
The Net Harbor Hub Chart Lab
Theoretical knowledge evaporates under real market pressure. The Chart Lab is our specialized practice environment in Chiang Mai where students conduct bar-by-bar market autopsies, blind chart replays, and stress-tested risk calculations.

The 4-Stage Chart Dissection Routine
How every student drills technical setups during studio laboratory sessions.
Blind Bar Replay
Participants receive historical market data with right-side price action masked. You must evaluate market regime and locate key structural liquidity pools without forward bias.
Pivot & Invalidation Tagging
Identify the exact swing low or high where your bullish or bearish hypothesis fails. Anchor your protective stop loss strictly behind this structural invalidation boundary.
1R Sizing Calculation
Using our proprietary Risk Matrix formulas, adjust your contract volume so that the dollar risk between entry and invalidation equals precisely 1 unit of risk (1R).
Target Mapping & Asymmetry Score
Map multi-stage liquidity targets. If the first opposing liquidity pool offers less than a 3.0R payoff potential, the setup is rejected without execution.
A Distraction-Free Analytical Sanctuary
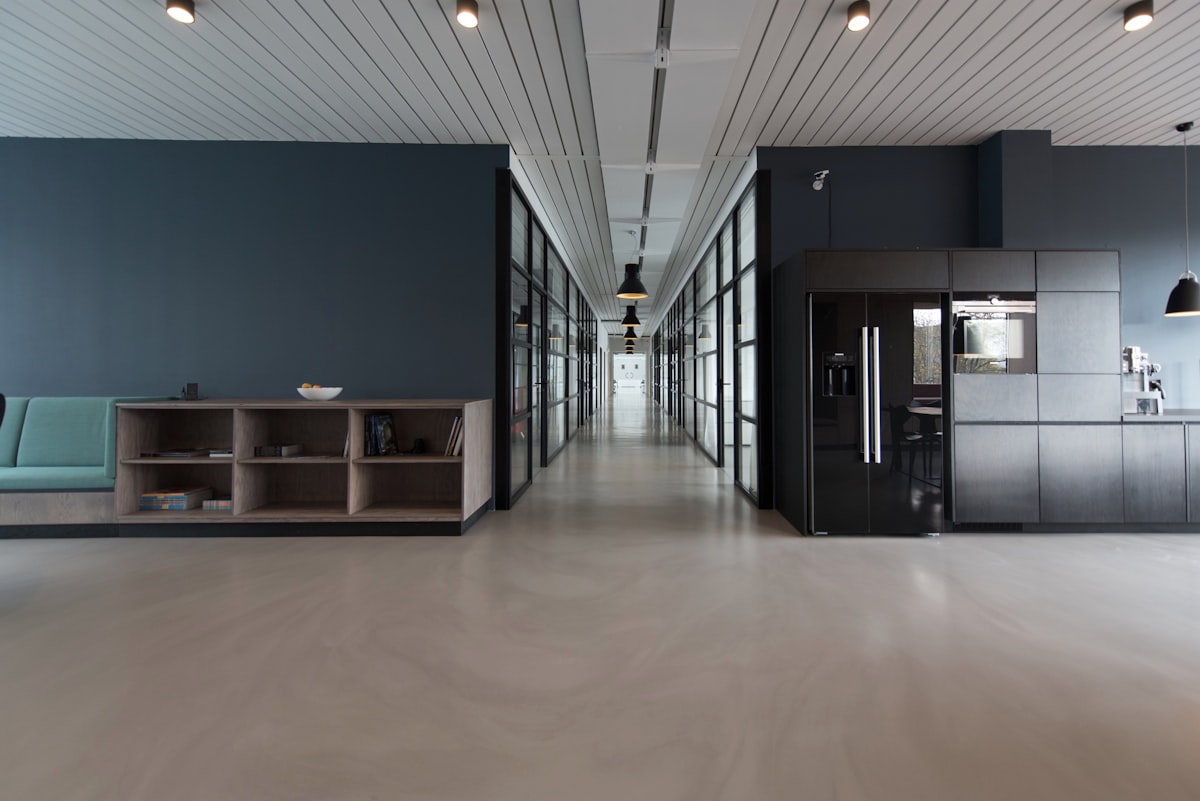
Situated at 76/3 Siri Mangkalajarn Road in Chiang Mai's Nimman/Suthep district, our physical studio was built to cultivate stillness, deliberate practice, and rigorous peer review.
Rather than noisy trading floors filled with emotional hype, our Chart Lab offers an academic seminar setting with ultra-high-definition multi-display stations, high-speed fiber feeds, and dedicated acoustic zones for private trade log post-mortems.
Remote hybrid participants connect via dedicated studio microphones and low-latency interactive screen sharing, participating in every bar replay debate in real time.
Experience the Chart Lab First-Hand
Enroll in our flagship Risk-to-Reward Analysis Clinic or schedule a private Trade Journaling & Behavioral Audit.